Plot.ly

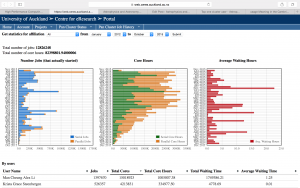
I’ve become a fan of Plot.ly — an online service for plotting data and sharing it. I was mainly interested in figuring out how to plot my useage of the NeSI PAN cluster computer — particularly for seeing how many computer nodes I was using at any given time, and how many jobs were left to do. I found that with Plot.ly you can stream data to their server and it will update a plot as the new data come in. Their tutorials for setting this up are reasonably straightforward, and I managed to write a little python code to stream the state of my jobs on the cluster (with a little help of crontab and scp):

Link to live streaming plot.

Screenshot from this afternoon:

plotly

2016 Honours Projects with NJR

Here’s my list of Honours projects for 2016. If you are keen to do one of these, please email me or drop by to discuss.

1. Creating a Differential Image Motion Monitor for Astronomical Seeing

This project will require the student to set up one of the Department’s 40 cm Meade telescopes as a seeing monitor. Seeing is a measure of atmospheric turbulence. This project will require the student to work with the engineering facilities to affix a DIMM mask to the telescope, set up a CCD camera on the telescope and run DIMM observation software to measure atmospheric seeing. The student will have to be comfortable working at night, and have a full driver’s licence.

Use one of these!

         Use one of these!


2. Multidimensional Dataset Visualisation with an Oculus Rift

This project will require the student to investigate the software available for displaying multidimensional datasets using an Oculus Rift. The key objectives are to have a suite of software tools available to allow a user to navigate complex multidimensional data via virtual reality immersion. Students should have a reasonable level of programming ability.

Use one of these!

             Use one of these!


3. Finding Earth-sized planets orbiting White Dwarf stars

This project will require the student to obtain estimates of the number of white dwarf stars visible in the 1.8 meter MOA-II telescope field of view, estimate how many of these systems would have a transiting earth-sized planet, and propose an observation schedule for use by MOA to discover these planets.

Find some of these!

                   Find these!


4. Detecting Atmospheric Meteor trails

Meteors entering the Earth’s atmosphere leave a trail of ionised particles. We have a software-defined radio system set up to detect radio signals from Christchurch which are forward-scattered off these trails. This system is working successfully, but can be improved upon. The honours project will comprise optimising the system to improve the number of detected meteor trails, to compile statistics of this year’s meteor showers and report them to the International Meteor Organisation. The project would also comprise making the observed data available via the Internet in real-time.

Analyse these!

                                                 Analyse these!

                                                 Analyse these!

Equipment issues

There were some equipment issues on the 27th and 28th of September, as well as the 9th and 11th of October so these days do not contain the full 24 hours worth of data, as the software was not recording continuously on these days.  The software, SDR# has a tendency to crash from time to time, usually after connecting to the computer to check that the noise floor has not dropped or increased. On 27th of September, I checked the program once just before noon and it was only the next day in the morning that I noticed that there were no files downloading in the DropBox throughout the day and over night. After connecting to the computer to see if it was still working, I saw that the program was not responding and I had to restart it. Since it seems that it was not be responding for most of the day of the 27th and over night on the 28th of September, no signals were detected and recorded and therefore those two days are also missing some data. The same thing again happened on the 9th of October, but I checked the program at around 10pm so only the data during the day from about noon until 10pm is missing. Seeing as those are approximately the times when there are the least amount of meteors entering our atmosphere, I can assume that majority of the signals for the 9th of October were recorded and only a few were missed.

A few days before the 11th of October, the noise floor started varying a lot and many false positive files were recorded that filled up the DropBox to its capacity. On the 11th of October, overnight, the noise floor dropped by a further 2dB and no files were recorded – both signals and random, varying peaks were missed. I made a decision to drive out to Ardmore with a USB stick to manually transfer the data from the computer to my laptop, which I used for analysing the data, and also check the equipment to see why the noise floor was varying so much. I checked all of the connections to see if anything had come loose and thus became a source of extra noise, including the connections inside of the balun of the antenna. After I checked the balun, the random peaks disappeared and the significant varying of the noise floor stopped and there was also an increase in signal detection. This could indicate that the connections inside the balun had either come loose throughout the project, maybe due to storms and wind at the location, or they were never properly screwed in from the beginning. I got in touch with a technician about the loose connection and this is currently in the process of being fixed. The increase in signal detection could also be due to the increased meteor activity from the Orionids meteor shower.

Since the onset of the project, a new version of the receiver has been released, called Airspy R2 so in the future, it might be useful to look into investing into the new receiver to see if it would increase the sensitivity of the equipment and be able to detect even more faint signals. A signal amplifier could be added to the antenna to amplify any low power signals, allowing for them to also be recorded. However, an amplifier could amplify the noise as well, thus looking into shielding the receiver would be necessary if an amplifier was to be added. A filter could also be added if wished, but it is not necessary as there is a frequency setting in the software that allows only the target frequency to trigger recording.

It has been very exciting and interesting to work on this project this year and I hope that next year someone will take over and carry on improving my set up and observing and recording meteor activity here in New Zealand.

Results

So, it’s been a while since I last wrote a post and I thought I should write an update with my results.

I have observed meteors for 98 days, and I have detected a few peaks of some meteor showers that have occurred during that time.

The following graph shows the cumulative number of meteors that have been detected over the course of the project. There are some clear peaks on the 3rd of August, and 19th of August, which correspond to the Southern Iota Aquarids and the Northern Iota Aquarids meteor showers respectively. According to the table mentioned in a previous post, there was another peak of the Northern Delta Aquarids meteor shower on the 13th of August, however this wasn’t detected. This might be due to the position of the radiant in the sky relative to my antenna. Since my antenna is very directional and only looks for meteors at a certain distance and direction (between Auckland and Christchurch), if the meteors from the meteor shower are not crossing this path then they won’t be detected.

Bar graph showing the cumulative meteor rates in each day over the course of the project.project.

Bar graph showing the cumulative meteor rates in each day over the course of the project

There is also a slight peak on the 19th of September, which corresponds to the peak of the Piscids meteor shower. The last meteor shower that was detected and recorded was the Orionids meteor shower, which peaked on 21st and 22nd of October. These two dates stand out from the surrounding few days and on both days there was the same number of meteors recorded.

There is a difference between the predicted hourly rate of the meteors during the peaks of the meteor showers, and the hourly rates that were recorded. This is because the predicted hourly rate, also called the Zenith Hourly Rate (ZHR), is the number of meteors per hour an observer would see if there were no obstructions in the observer’s view, no light pollution either from surrounding lights or the Moon, and the radiant of the meteor shower was at the zenith. This means that the ZHR only applies to visually observable meteors in ideal conditions, whereas my antenna looks for radio signals that have been reflected off meteor trails, regardless if the meteor was observable or not. This indicates that I should have detected more meteors than the ZHR predicted for all meteor showers, however as mentioned previously, since my antenna is very directional, the meteors need to cross the path between the receiver location and the transmitter location. This means that quite possibly a lot of the meteors from the meteor showers could have been missed. The exception to this explanation is the Southern Iota Aquarids meteor shower, which peaked on the 3rd of August. The peak of the meteor shower had more meteors detected than what the ZHR predicted. This indicates that the comet which formed the Southern iota-Aquarids meteor shower has left behind many small particles that cannot be visually observed, but can form a trail which is sufficient to reflect a radio signal.

The following graph is the cumulative number of meteors that were detected in each hour over the course of the project. The shape of this graph fits with the theory that there are more meteors entering our atmosphere in the early morning hours than during the day, however there is a distinct peak at 11pm.

Bar graph showing the cumulative meteor rates in each hour over the course of the project.

To try and figure out where this peak could have come from, the hourly meteor rates were graphed for each month.

Bar graph showing the cumulative meteor rates in each hour in each month during the project.

This graph shows that there is a peak at 11pm for each month. For each meteor shower that was observed, their radiants transit close to midnight, which means that at around 11pm, the radiants of the meteor showers are at an optimal position relative to the antenna direction and so the most meteors can be detected at this time. August has the highest peak, which may also come from the July meteor showers, (Pisces Austrinids, Alpha-Capricornids and Southern delta-Aquarids) whose active dates over lap with the active and peak dates of the August meteor showers that were observed. Although the peaks for the July showers were not detected, as the project was not running at the time, the remnants of those showers could have affected the August meteor rates. All three July showers have radiants that transit close to midnight, thus these meteors can also contribute to the increased number of meteors at 11pm for the month of August.

Since all months contribute to the peak at 11pm, this project would need to be run for longer than 3 months in order to link this peak to the radiant of each meteor shower and when it gets above the horizon. By observing meteor activity for a longer period of time, and observing the other meteor showers that occur throughout the year, the peak times and their relationship to when the radiant reaches a certain altitude could be checked and tested.

The following pie chart shows the relative amount of long overdense, short overdense and underdense meteor trails. This chart shows that 54% of the total number of signals that were detected were reflected off underdense meteor trails, while 23% were long overdense and 22% were short overdense meteor trails. From this figure it can be deduced that out of the total number of 4261 signals detected, the chances of the meteor trail being underdense or overdense (either short or long) are almost equally likely – close to 50%. However, for this to be fully statistically confirmed, the project would have to be run for a much longer period of time.

Pie chart showing the amount of long overdense, short overdense and underdense meteor trails detected.

Last, but not least, I have made a video and posted it on this link here, to help explain how the software works and what I am looking for.

So that’s it with the results! I have observed meteor showers and their peaks, and have confirmed the prediction that most meteors enter our atmosphere in the early morning hours. I have found a distinct peak of meteor activity at 11pm which I could only link to the radiants of the meteor showers. To fully confirm this, the project would need to be run for much longer. Last, but not least I have found that detecting underdense and overdense meteor trails are close to being equally likely.

Minor Planets in the MOA Database

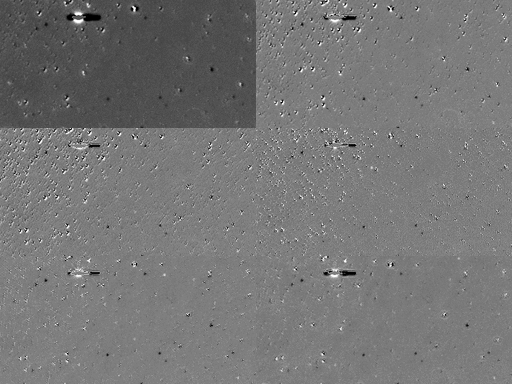
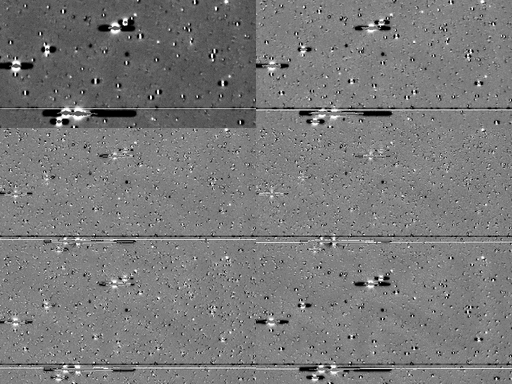
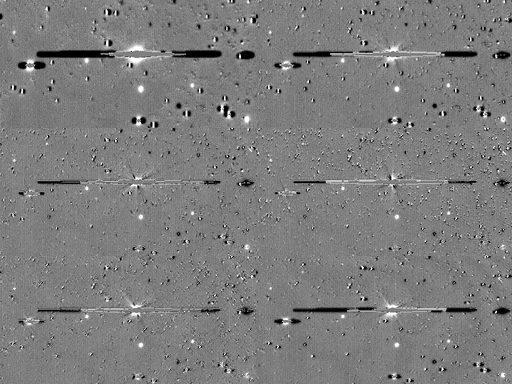
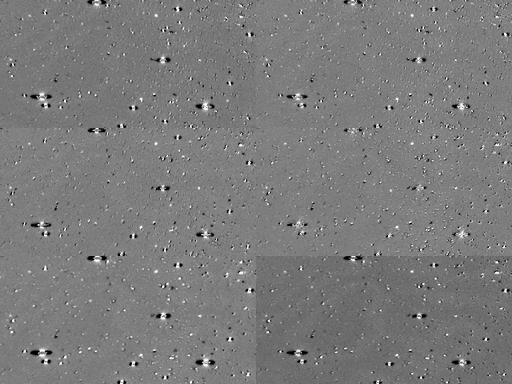
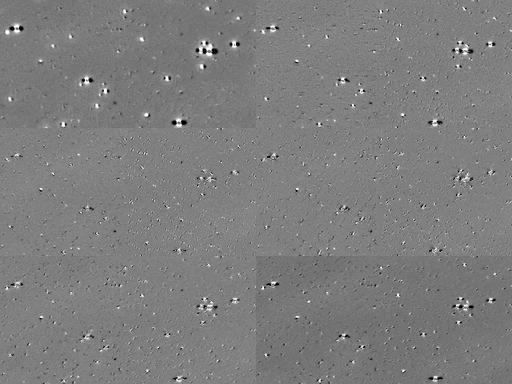
Here are some little animations of minor planets passing through some of the crowded star fields in the MOA database. The images are difference images, meaning that the images of stars have been subtracted away. What you’re looking for in each of these animations below is a moving dot — an asteroid moving through the field.

Each one of these images is 1 / 640 th of the total field of view of one of the MOA-II telescope’s fields. And MOA observes 22 fields towards the Galactic Centre. I found these by eyeballing the images. Working on a better way.


Exoplanet Hunting using Gravitational Microlensing – Academic Poster

Creating an academic poster is a challenge because you never quite have enough space on your canvas to say all you want to say about your research. You have to be extremely selective and ruthless about the content that makes it to the final copy. This is what I found most challenging about making an academic poster.

I submitted a poster to the Faculty of Science Postgraduate Poster Competition recently. It came out to be in the top 20 and has been entered to the Exposure Poster competition. If you didn’t get a chance to stroll down to the basement of our office building to check out the many posters displayed there last week, here is my poster about my research. Hope you enjoy reading it!

Exoplanet_Hunting

Meteor showers and different types of meteor trails

Okay, so the Perseid meteor shower has passed and I didn’t detect as many meteors as I expected, so I did a little bit of an internet search and found that the Perseid meteor shower is actually a Northern Hemisphere shower. The radiant (the point from which meteors seem to originate from) doesn’t get as high up in the sky for us and thus the Southern Hemisphere does not  get as many meteors. On top of that, they were coming from the North, while my antenna is pointing South so this seems to explain why I detected no difference in my meteor count.

However, I found a website which gives a list of meteor showers for the Southern Hemisphere, so I will be referring to this from now on and see if what I am getting is matching with what is written here.

Now, how do I know that my radio signal is reflecting off a meteor trail?

According to the research paper, “Forward scattering of radio waves off meteor trails, 1995” by Jean-Marc Wislez, in classical theory of meteor scatter, there are two extreme cases of meteor trails that can occur – the “underdense” meteor trail and the “overdense” meteor trail. When a meteoroid enters our atmosphere, the atoms in the atmosphere become ionised, thus creating a trail of free electrons and ions. It is the free electrons that contribute the most to the scattered signal. If the line density (i.e. the number of electrons per unit of length of the meteor trail) of ionisation is low, then the incident wave penetrates the meteor trail and the electrons absorb the energy of the wave. This makes them oscillate and thus they re-emit the radio wave in all directions. The radio signal that is scattered in this way is said to have scattered off an “underdense” meteor trail. If the line density of ionisation is high, then we assume that the meteor trail acts like a metallic cylinder whose radius is much larger than the wavelength of the radio wave. This approximation assumes that the incident waves scatter off the surface of the cylinder since the radio waves cannot penetrate the central part of the trail. This type of trail is called an “overdense” meteor trail. However, the “metallic cylinder” approximation has flaws, as it does not take into account any low density part of the meteor trail, and it assumes that the power of the scattered signal in the perpendicular direction to the meteor trail is directly proportional to the radius of the cylinder.

Here is a simulation of a power-time graph, based on theory, of an underdense and a short overdense meteor trail (taken from the “Forward scattering of radio waves off meteor trails” paper):

Power-time graph of an underdense and a short overdense meteor trail. Reference: Forward scattering of radio waves off meteor trails - Jean Marc Wislez

Power-time graph of an underdense and a short overdense meteor trail. Reference: Forward scattering of radio waves off meteor trails – Jean Marc Wislez

And here are examples of some of my observations:

As it can be seen in the graphs, the power-time graphs of the underdense and short overdense meteor trails almost perfectly match the predicted simulations. The only difference is that some of the fluctuations that I got could be due to the signal itself as I am using an FM radio signal, whereas in the research paper they used a constant amplitude signal. However, these signals are both quite short so I think it’s safe to assume that in these two moments the signal was very close to being constant in amplitude and thus they seem to fit the theory.

an underdense and short overdense meteor trails

Now, there is also a third type of power-time graph that can happen, and this meteor trail is called a long overdense trail. In the research paper that I keep referring back to, there isn’t a simulation to predict this type of meteor trail, however it was detected and this is the observation that they made:

Power-time graph of a long overdense meteor trail. Reference: Forward scattering of radio waves off meteor trails - Jean Marc Wislez

Power-time graph of a long overdense meteor trail. Reference: Forward scattering of radio waves off meteor trails – Jean Marc Wislez

And here is an example of a long overdense signal that I detected. As it can be seen,
all three types of graphs seem to fit predictions or observations that have already been made and thus I conclude that what I am detecting really are meteors. The only one that is difficult to say that it was reflected off a meteor trail for sure is the long overdense meteor trail as it lasts much longer than the others, and thus the signal itself can fluctuate in power as it is an FM radio signal. It is very difficult to remove the actual signal fluctuations to compare to the long overdense meteor trail observation.

A long overdense meteor trail

I should also point out that these examples I showed are the “perfect” examples I found. There are signals that I have detected whose power-time graphs aren’t exactly as what is predicted, but still follow the similar patterns. The variations in the graph could be due to the fact that my signal is not constant in amplitude, but also these simulations count on ideal conditions and make approximations and assumptions that do not always happen in real life. Meteor trails can be in any size and shape, depending on the size of the meteor, its speed, direction and also wind, therefore the radio wave reflections can be quite different from these ideal predictions.


I have good news and bad news. Bad news is that I only started my data collection at around 11.40pm on 27th July, which is later than I was hoping, and good news is that everything is working perfectly!

There are a couple of reasons I ended up starting so late, and one of the reasons is actually because of the other. So, I was originally copying and pasting my files from the Ardmore computer onto my laptop, but this turned out to be very slow and time consuming, so instead I installed the Dropbox and set up SDR# so that it automatically uploaded the files onto it once the signal was recorded. While copying and pasting, I remained connected to the computer, but when I started using the Dropbox, I started disconnecting. This is because the internet connection in Ardmore is generally weak and slow and everything would significantly slow down when I was still connected while the files were uploading. I also installed the Dropbox onto my own laptop and when files arrived, I’d put them into another folder to keep the Dropbox space free, and I’d remain disconnected, waiting for more files to arrive as they were being recorded and uploaded to the Dropbox. However, the files just wouldn’t arrive, so I’d connect again and see that nothing was recorded. This always led me to the conclusion that my settings weren’t good enough and I kept missing the signals, so I would change the settings, wait until a signal was detected and recorded to make sure that the setting was good, and then I would disconnect again, to wait for the files to arrive.

This was the first mistake – even when I had recorded signals before, they were recorded with a different setting, so every time I changed something I was pretty much starting all over again. Now, this went on for a few days – almost a week actually. Then I started to notice a pattern. I’d disconnect overnight, hoping for signals to get recorded and that I’d wake up with a full Dropbox, (because everything I have read about meteors said that most meteors enter our atmosphere between midnight and 7am), and I’d be disappointed every single time, thinking how it doesn’t make sense that there was absolutely nothing overnight (which contradicts my readings), especially when we are nearing a meteor shower. So then I would go on to change the settings, but before I did, I would just stay connected for a little bit and wait to see if anything happened. Now, if my setting was accidentally made so sensitive that even the noise level would trigger recording, then all of a sudden SDR# would start recording almost immediately. This also didn’t make sense to me. Why wasn’t the noise level triggering recording overnight, if it’s doing so now?

After a few days of this happening, no matter what setting I changed to (and honestly, I was running out of ideas of how to combine all the settings in a way that I didn’t try before), it finally clicked. Every time I disconnected, the program basically paused and didn’t record anything. That means, that not only was I constantly changing settings, I wasn’t consistently even recording the signals. This is the big mistake I made in my way of thinking – I assumed that everything was still working after I disconnected. This should have been the first thing I checked, even before starting any recordings. I don’t even want to think about how many signals I’ve missed, how many perfect settings I may have gotten and then changed, and how much sooner my data acquisition would have started if I had just checked this first. I guess this is what research is about and sometimes, something that seems so trivial doesn’t even enter the thought process.

I found a way now to disconnect without stopping the program, and I found a good setting that works perfectly, and everything over the last few days has been exactly the way I expected, with a few minor exceptions. One of those is that the program crashed one time, but luckily SDR# saves the last setting so I just had to restart it (but if there was a signal during those few seconds, it was missed). Another thing that happens a lot is that the whole noise floor jumps up for a split second and triggers recording. The only idea that I have at the moment to reason with this is that there may have been a spark somewhere nearby. This is something I have to look into and ask about. If it’s not a spark, I would like to find out what it is, because sometimes the noise floor only slightly twitches, and then sometimes it jumps up incredibly high. At the moment it seems random, although I will look into it to see if there is a pattern (i.e. maybe it happens every hour, or at the same time every day, etc).

Here is a picture of what I mean, so that it makes more sense:

A representation of where the noise floor normally is and how much stronger the Auckland ZM radio station is on the left, at 91.0MHz.

A representation of where the noise floor normally is and how much stronger the Auckland ZM radio station is on the left, at 91.0MHz.

Noise floor jumping. Notice how it's almost the same height as the Auckland ZM radio station, at 91.0MHz

Noise floor jumping. Note how it’s almost the same height as the Auckland ZM radio station, at 91.0MHz

Anyway, I’m just happy that, although I started later than I was planning to with my data acquisition, I figured it out and got my project back on track, and  now that everything is working with it, I can start to focus on analysing all of it!

Update

Last week I wrote about how I didn’t have remote access to the computer in Ardmore anymore because of the storm. That has now been restored – I asked our IT service to help me, and it works now and everything is back on track.

As I mentioned in a previous blog post, I thought that my originally chosen frequency of 101.7MHz may have been too weak to detect and so I decided to change to a stronger frequency. This is showing up some results! Currently I am tuned into 91.3MHz, which is the ZM radio station in Christchurch. The way that the software records the signal is that it records the whole bandwith that I can see on my screen (from about 90.8MHz to approximately 91.4MHz), and not just the 91.3MHz frequency. That means that while I’m recording 91.3, I am also recording 91.0, which is ZM in Auckland (ZM plays current pop music), and 91.4 which is Radio Concert (which is classical music) in the Waikato area, as my antenna can easily pick up the radio stations from there.

What is interesting, is that sometimes, when I detect a signal at 91.3MHz, there is also a peak that shows up on the 91.2MHz frequency.
To help explain better, here is a screenshot from a signal that was recorded on 07/21/2015  at 04:14:07.

A screenshot of one of the signals I detected at 91.3MHz

A screenshot of one of the signals I detected at 91.3MHz

Here, we have the Auckland ZM station on the left, at 91.0MHz, and we have the Waikato Radio Concert station on the right at 91.4MHz.  In between, there is a signal at 91.3MHz, which is ZM in Christchurch (and I will explain why I’m so sure of it shortly), but there is also an unknown signal at 91.2MHz. Looking at the list of radio stations in NZ, I saw that a possible radio station at this frequency is Radio Concert in Nelson. Looking at the map of NZ, we can see that Nelson is between Auckland and Christchurch and so it is possible that if a meteor (or something else) happened to fly between us and Nelson, it could have reflected both frequencies from Nelson and Christchurch. Although, I still have to prove this to myself geometrically, rather than assume that it can happen.

Okay, so at first I was a little bit skeptical, as it seemed a little bit too good to be true – that I can actually detect two frequencies that have reflected off something in our atmosphere seems a bit lucky. However, these signals are so strong that you can actually hear the music. So when I played the signal I detected on 91.3MHz, I heard a part of a Miley Cyrus song that was recorded, and when I tuned into the 91.2MHz, I heard classical music. This was my initial confirmation that I have detected ZM from Christchurch and Radio Concert from Nelson. Now I needed confirmation that what I recorded actually came from those stations. Assuming that all transmitters of the same  radio station play the same stuff at the same time (except maybe the ads), I listened to the 91.0MHz frequency I recorded, (which, as I said before, is ZM in Auckland) and it was the exact same part of the song  that was recorded on 91.3. Then, I tuned into the 91.4MHz frequency, (which is Radio Concert in Waikato) and I heard the part of the piano that sounds exactly the same as what was recorded on 91.2MHz.

I checked the list of all the radio stations again, and saw that there is no other ZM station in NZ that is being broadcast at 91.3MHz, and no other Radio Concert station in NZ that is being broadcast at 91.2MHz. All of these reasons led me to conclude that I have actually recorded two signals from the South Island, that have been reflected off something in our atmosphere because they are both too far away to be received directly.

This still seems too good to be true to me. It just happened, by luck, that I can record all 4 radio stations and compare the recorded signals to the actual signals that I definitely know were being broadcast at the time of recording.

I have emailed one of the radio stations to confirm that they play the same songs at the same time everywhere in the country. Now, what I have left to do is to actually figure out how to interpret these signals.

How do I find out that these signals were reflected off a meteor? Well, that’s a post for next time 🙂