While there are any number of excellent software products available to help an observer plan an observing session, I was more interested in producing a single image that could give an idea of what objects were in prime viewing position.
Using astroplan, astropy, adjustText and jplephem, I have a first attempt done.
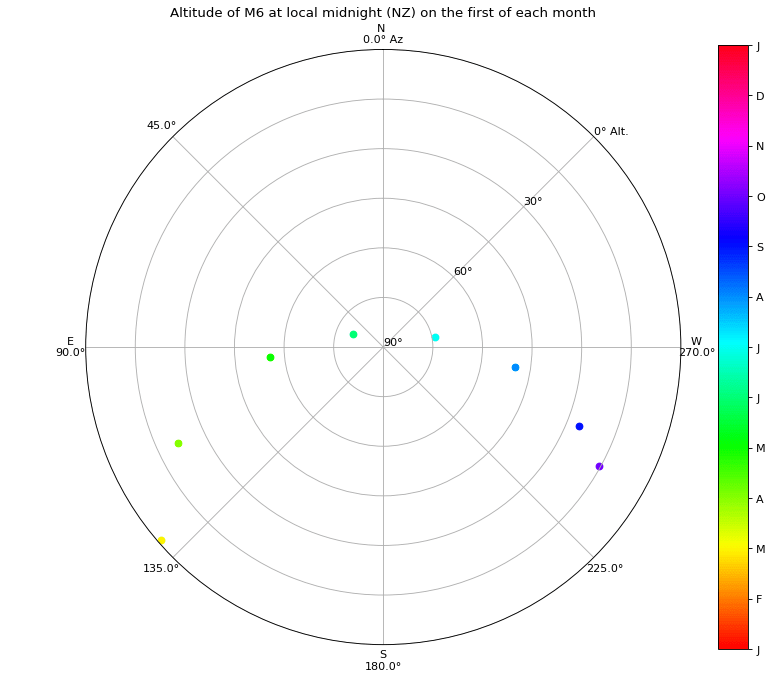
So far the code will plot out the maximum altitude of a set of objects, as seen from an observer’s position on Earth, as a function of the day of the year. I gave some indicative altitude curves for some objects, to get a sense of their position change across their maximum altitude. The small number at the start of each curve is the azimuth.
The input is currently one of the Messier and NGC catalogues, but any list of objects can be included as a csv file. The object needs to be resolvable via astropy’s SkyCoord call.
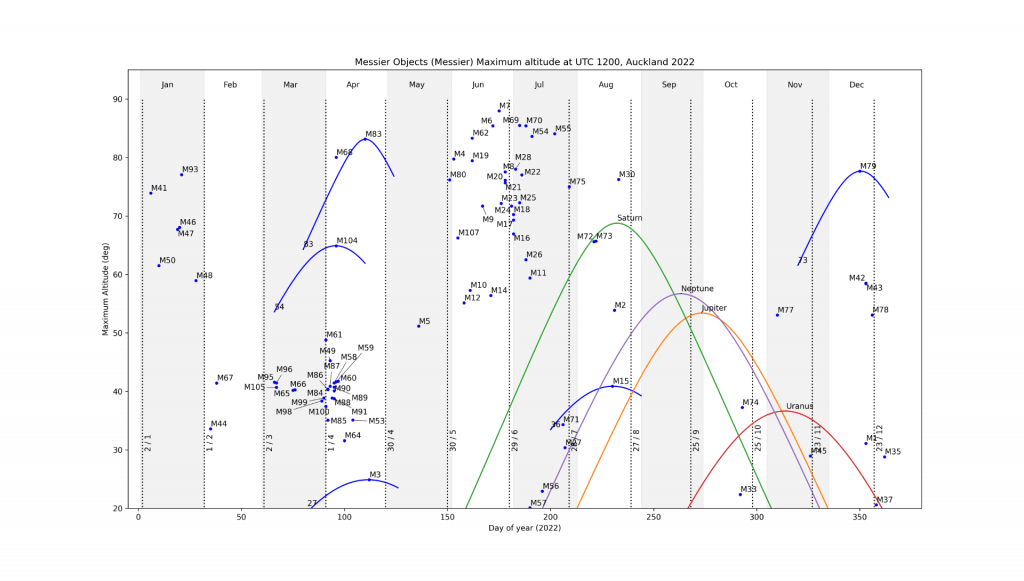
Maximum altitude of Messier objects, Auckland, NZ at UTC 1200 in 2022. Times of new moon are shown with dashed vertical lines.